Data & Analytics
One trusted version of the numbers, and a view of what happens next.
The promise
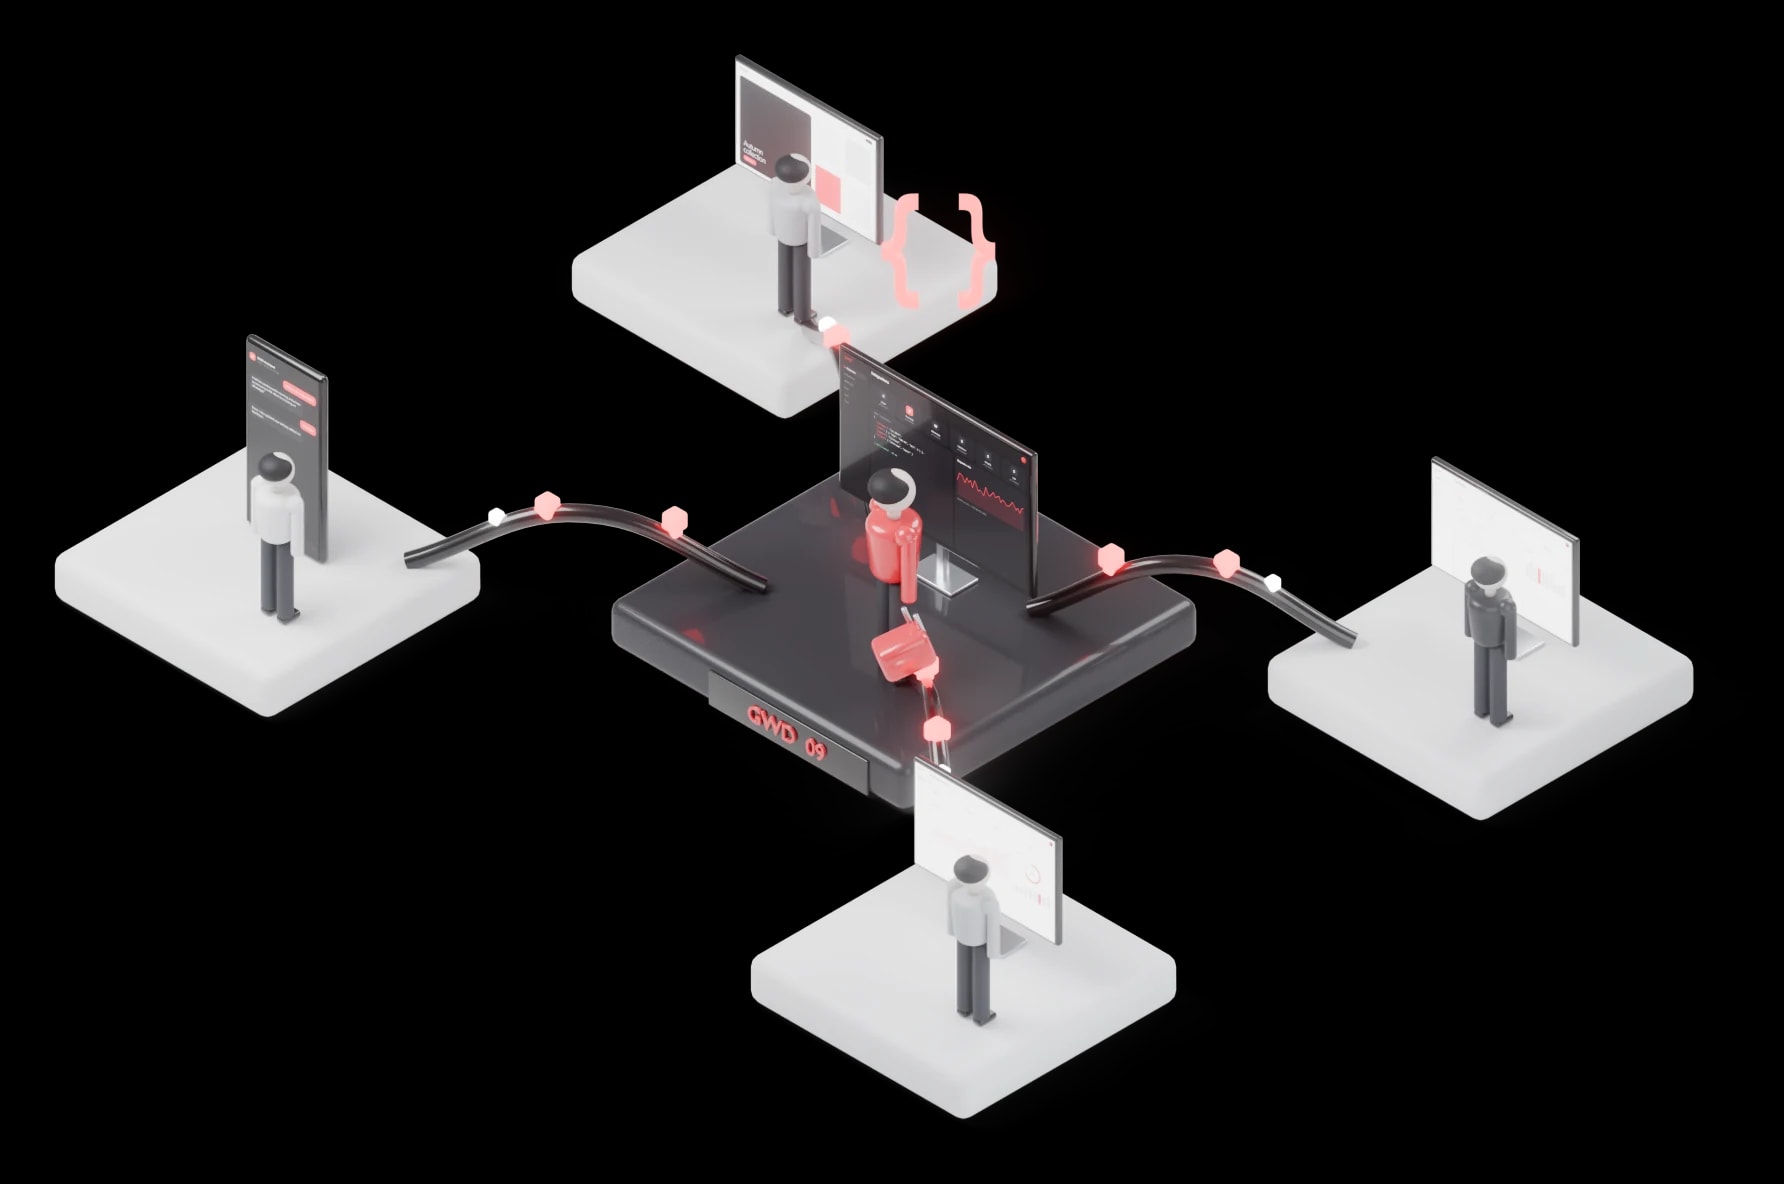
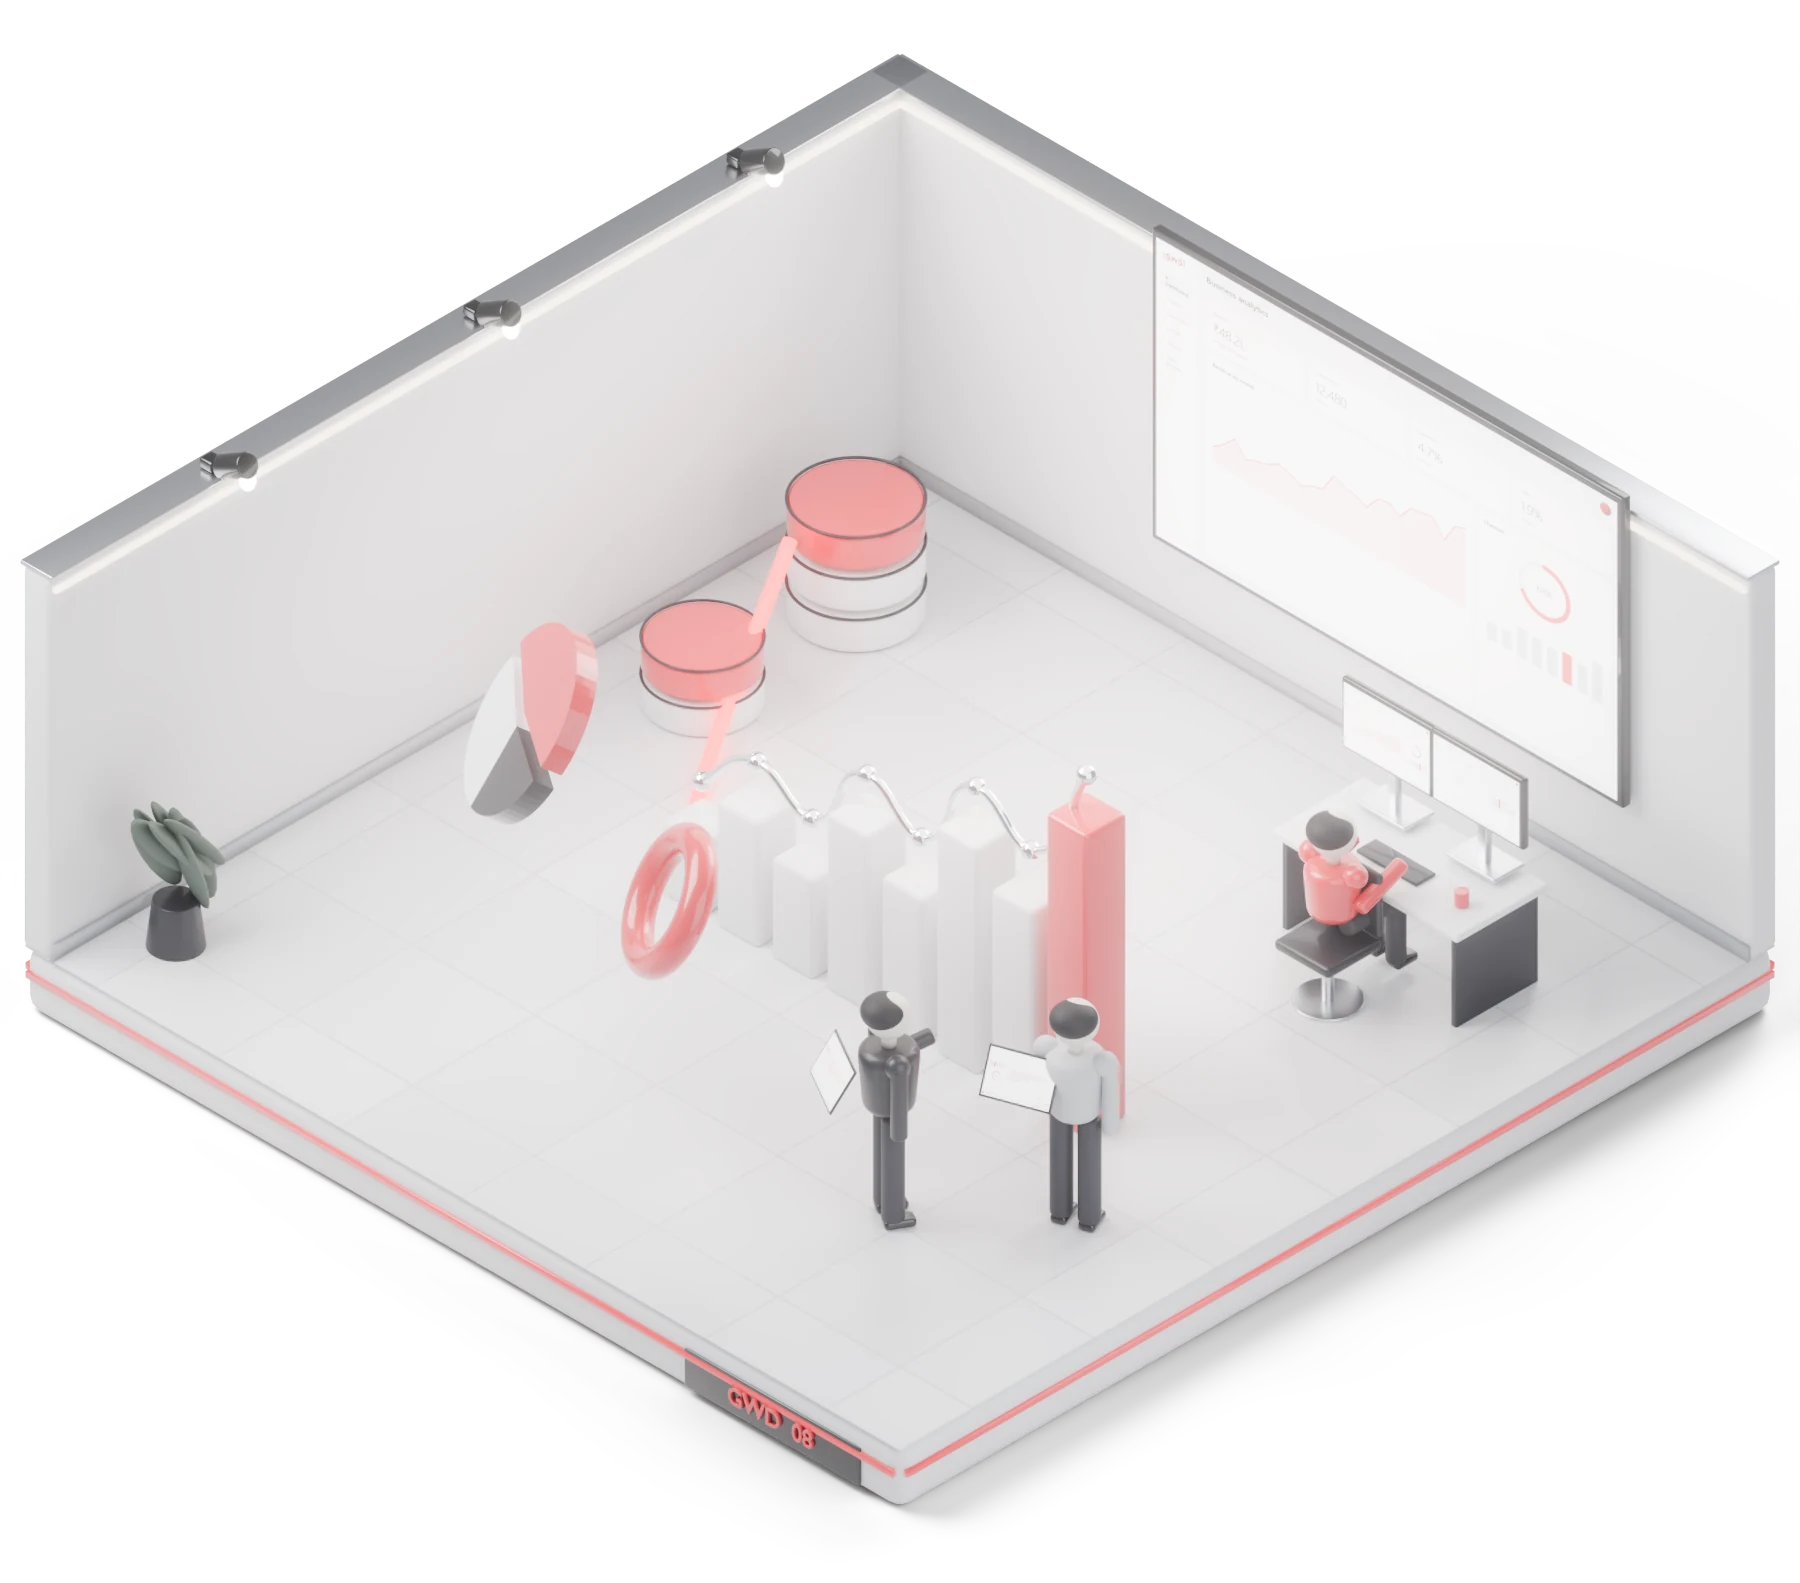
We pull data out of the systems it is trapped in, clean and model it in one place, and put it in front of the people making decisions. Then we go past reporting to forecasting: demand, churn, collections and the metrics your business actually runs on.
What we do
Data & Analytics, in practice.
- 01
Data pipelines
Reliable ingestion from apps, databases, spreadsheets and APIs, scheduled and monitored.
- 02
Warehouses & lakehouses
BigQuery, Snowflake, Databricks or PostgreSQL modelled for fast, consistent queries.
- 03
Dashboards & BI
Power BI, Looker Studio, Metabase and Superset dashboards built around decisions, not vanity metrics.
- 04
Predictive analytics
Forecasting, segmentation and churn models, with accuracy tracked over time.
- 05
Real-time streams
Event pipelines with Kafka for live operational data.
- 06
Data quality & governance
Validation, lineage and access rules so every number can be trusted and traced.
What you get
- Data audit & KPI definitions
- Automated ingestion pipelines
- Modelled data warehouse
- Executive and operational dashboards
- Forecasting or ML model
- Data dictionary & documentation
Who it suits
- Leadership teams reconciling numbers across spreadsheets
- Operations that need live visibility
- Companies ready to forecast instead of react
The tools behind it
- Python
- pandas
- NumPy
- Jupyter
- Apache Spark
- Apache Airflow
- Apache Kafka
- Airbyte
- PostgreSQL
- BigQuery
- Snowflake
- Databricks
- ClickHouse
- Elasticsearch
- Power BI
- Looker Studio
- Metabase
- Apache Superset
- scikit-learn
- Mixpanel
- PostHog